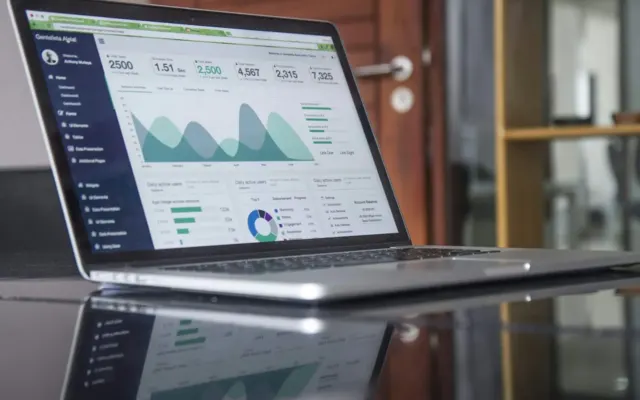
An economic dashboard can contain many attractive charts without helping its audience decide anything. The World Bank’s public data resources illustrate the range of information available, but availability is not a reason to include every indicator. A useful dashboard begins with a business or policy question and preserves the context needed to interpret the measures selected to address it.
1. Define the decision and the audience
A hypothetical exporter assessing demand in a new market needs different information from a local employer planning recruitment. State what the reader may do differently after reviewing the dashboard. That purpose helps determine the relevant geography, time horizon and level of detail.
Identify the limits of the dashboard as well. It may support monitoring without providing a forecast, or provide context without resolving a causal question. Making those limits explicit helps prevent an informative display from becoming an unsupported recommendation.
2. Choose a small set of complementary indicators
Look for measures that illuminate different parts of the question. Several indicators that all describe the same activity can create the appearance of corroboration without adding much information. A more balanced selection may include demand, capacity, prices and a measure of uncertainty, depending on the task.
For each indicator, record the source, unit, population and reference period. Explain why it belongs. If the team cannot describe what a chart contributes to the decision, removing it may improve the dashboard more than refining its visual design.
3. Align the comparisons
Different publication schedules can leave one series more current than another. Mark the latest available period for each, rather than implying that everything describes the same moment. Use consistent transformations where a comparison requires them, and explain when consistency is not possible.
Missing observations need deliberate treatment. A blank value is not a measured zero, and carrying a previous value forward can create a misleading impression of stability. The method should be visible enough that a reader can understand what the display is doing.
4. Make the visual hierarchy serve interpretation
Use titles that state the measure and units clearly. Keep axes, legends and annotations readable at the intended display size. A dramatic change in color or scale should have a reason connected to the question, rather than merely making the chart look more interesting.
Provide access to the underlying information where appropriate. A downloadable table, source link or concise methodology note can help a reader investigate a surprising result. Accessibility and reproducibility are part of making the dashboard usable.
5. Establish a review and maintenance process
Assign responsibility for updates, failed data feeds and revisions. A dashboard that silently stops refreshing can become a record of old conditions presented as current information. Displaying an update date helps, but someone still needs to respond when the process fails.
Finally, ask whether the dashboard changed the quality of the conversation it supports. Did it reveal an assumption, identify a useful question or prompt an appropriate review? Those outcomes matter more than the number of charts. A strong dashboard turns accessible data into a clearer decision context without claiming that the display decides for its reader.