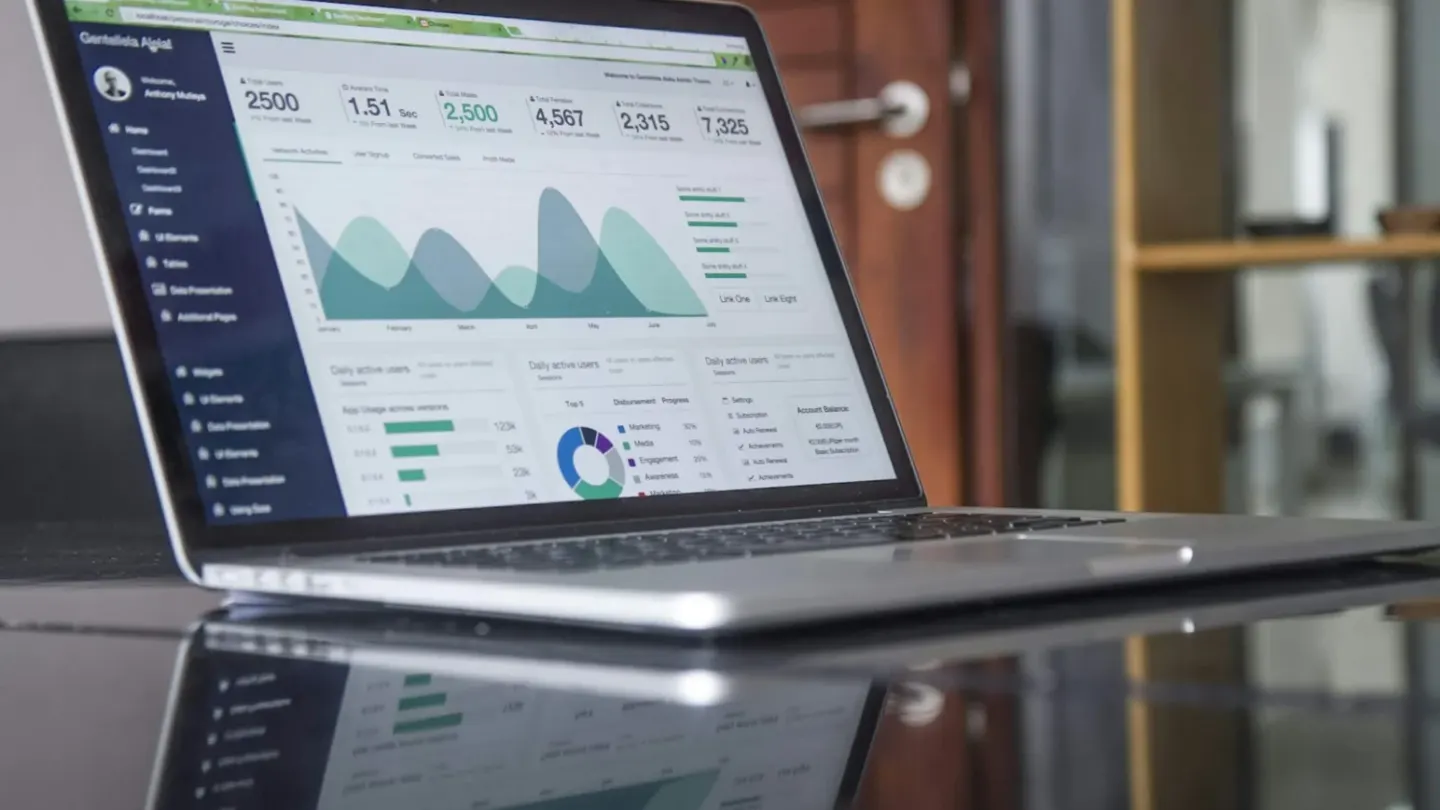
Open data makes economic information easier to explore. The World Bank’s data resources provide access to indicators across economies and topics. That access is valuable, but it does not eliminate the interpretation work. A reader needs to understand what an indicator measures, where it comes from and whether the comparison being made is appropriate.
Read the metadata before drawing the line
An indicator’s name can sound familiar while its technical definition is more specific. Coverage, units and collection methods can affect what the number means. A missing value is also different from a measured zero, and silently treating the two as equivalent can distort an analysis.
A hypothetical comparison of countries should examine whether the figures refer to the same year and use a consistent basis. A chart that mixes periods may look orderly while comparing different economic moments. The visual design cannot repair that mismatch.
Make transformations visible
Adjusting for population, prices or currency can help answer a particular question. Each transformation also changes the interpretation. The chart should identify the unit and explain important choices in language a reader can understand without reconstructing the calculation.
Reproducibility helps. Save the source, download date and transformation steps. If the dataset is revised later, that record makes it possible to explain why a previously published chart differs from the current download. Transparent methods support both scrutiny and correction.
Use the chart to open a question
An observed association does not establish its cause. A compelling visual can suggest a relationship worth investigating, but additional evidence is needed to explain the mechanism. The strongest data story combines clear measurement with an honest account of what the numbers cannot resolve on their own.